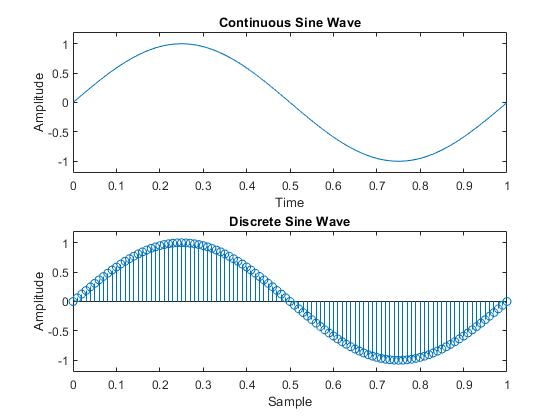
%SignalGen

n = 0:0.01:1; %Timebase

xn = sin(2*pi*n); %Sine signal

%Cont. Plot Settings
subplot(2,1,1),
plot(n,xn)%Plot sin vs n
xlabel('Time')
ylabel('Amplitude')
title('Continuous Sine Wave')
axis([n(1) n(end) -1.2 1.2]);
hold on

%Disc. Plot Settings
subplot(2,1,2),
stem(n ,xn)
xlabel('Sample')
ylabel('Amplitude')
title('Discrete Sine Wave')
axis([n(1) n(end) -1.2 1.2]);